Performance Trends Over Time: Forecasting Edges in Soccer Matches and Equine Contests
Written by Jonas Bennett · Jun 28, 2026
Performance Trends Over Time: Forecasting Edges in Soccer Matches and Equine Contests
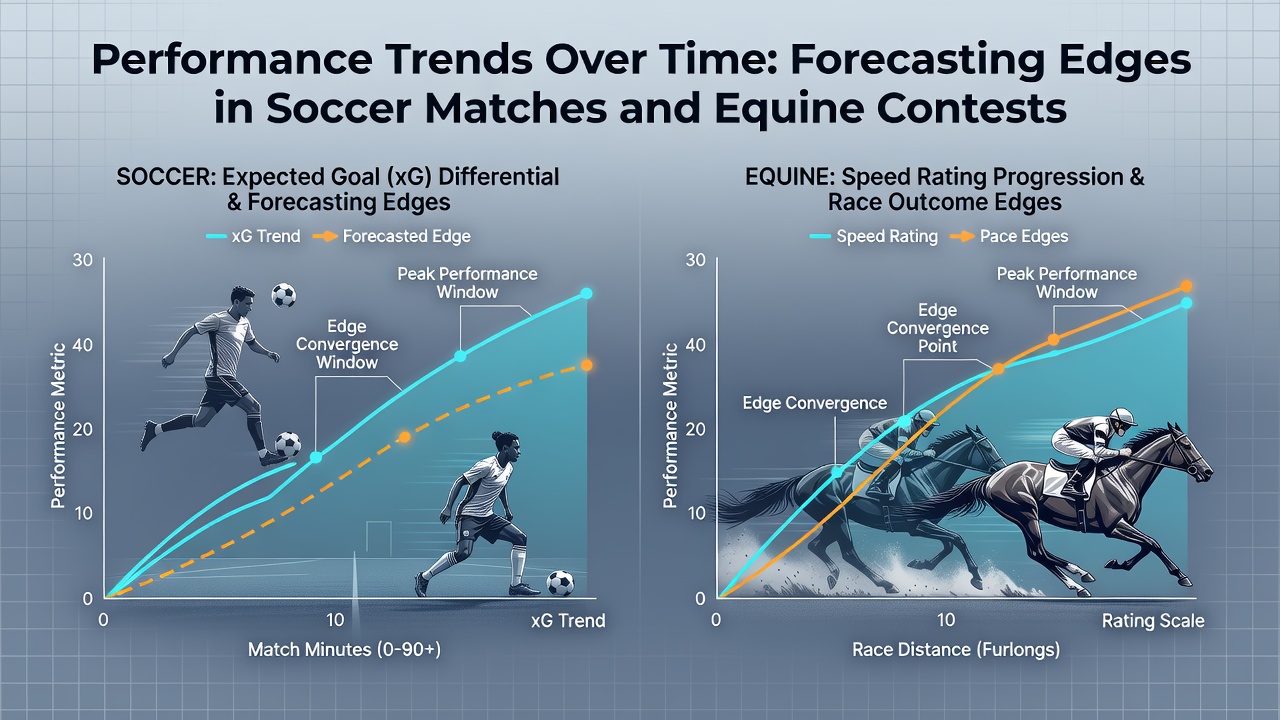
Analysts track performance metrics across extended periods to identify patterns that inform predictions in soccer fixtures and horse racing events, and data collected through structured observation reveals how consistency or shifts in output develop over months or years. Teams and horses exhibit measurable changes in key indicators such as goal creation rates, defensive solidity, sprint speeds, and stamina markers, while time-series models applied to historical records help quantify these movements and project likely outcomes in upcoming contests.Tracking Soccer Performance Through Seasonal Data
League records from European competitions show that clubs maintaining stable squad compositions often sustain higher average expected goals values across consecutive campaigns, and researchers compiling datasets from multiple divisions note that midfield control metrics tend to fluctuate less when coaching structures remain intact. Form curves built from match logs spanning five or more seasons allow observers to distinguish between short-term variance and longer structural advantages, while regression analysis applied to player availability data highlights how injury clusters during winter months alter subsequent spring results in measurable ways.
Advanced tracking systems deployed in major leagues capture positional data at high frequency, and these inputs feed into algorithms that adjust for opponent strength and venue effects over rolling windows of twenty matches. Studies examining output from the 2024-2025 and 2025-2026 campaigns indicate that teams improving set-piece conversion rates by more than eight percent year-over-year frequently carry that edge into the following season, although the magnitude diminishes once opposing analysts adjust marking schemes.
Equine Performance Patterns Across Racing Cycles
Thoroughbred and standardbred records compiled by racing authorities demonstrate that horses reaching peak condition at specific points in a campaign produce repeatable speed figures when surface and distance align with prior successful efforts, and time-based modeling of workout data combined with race outcomes helps forecast readiness for upcoming starts. Age-related curves appear consistently across populations, with three-year-olds showing rapid gains in distance aptitude during spring campaigns while older runners often stabilize or decline in closing sectional times after repeated hard races.
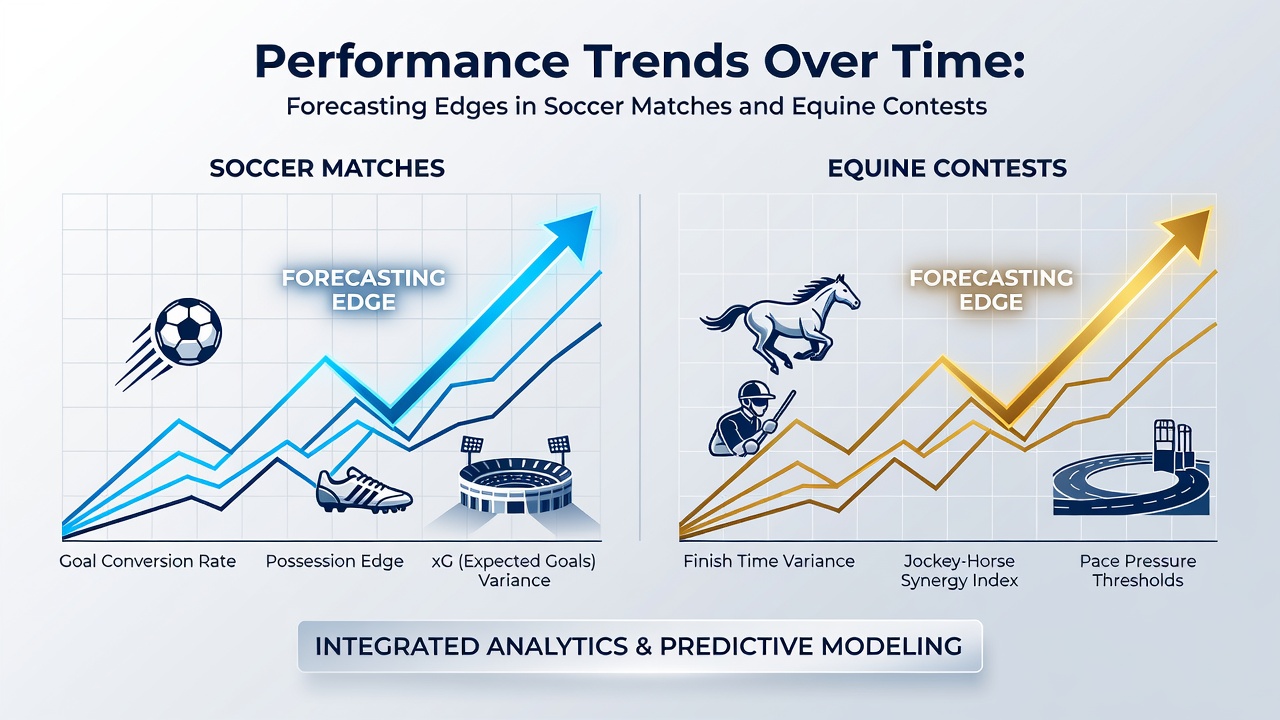
Handicapping databases maintained by organizations such as Racing Australia aggregate sectional times and margin data over multiple years, enabling comparisons that account for track bias evolution and seasonal weather impacts. Figures from flat and jumps programs in 2025 reveal that horses recording improving ratings over their last four outings achieve higher strike rates in June 2026 features when rested appropriately between starts, whereas those peaking early in the calendar year show reduced margins in later summer events.
Comparative Analysis and Integrated Forecasting Models
Statistical agencies in several jurisdictions have begun cross-referencing soccer and equine datasets to examine whether environmental factors such as temperature ranges or fixture congestion produce parallel effects on output consistency, and preliminary outputs from collaborative research projects suggest modest correlations between high-heat periods and reduced closing speed or pressing intensity. Machine learning frameworks trained on combined historical files adjust probability estimates by weighting recent trends more heavily while retaining baseline performance established over longer horizons.
National bodies including the Canadian Sport and Racing Oversight publish periodic summaries that document how travel schedules and surface transitions influence both athlete and equine recovery curves, providing additional inputs for models that forecast performance decay or rebound. Observers applying these layered approaches report improved calibration between projected and realized margins when updates incorporate both competition-specific and cross-domain variables.
Conclusion
Longitudinal performance tracking supplies a factual foundation for estimating edges in soccer matches and equine contests by quantifying how metrics evolve rather than relying on isolated results, and continued refinement of data collection methods supports more precise differentiation between sustainable trends and temporary fluctuations. Organizations that maintain comprehensive archives enable repeated validation of forecasting techniques across diverse conditions and timeframes.