Mapping Athlete Fatigue Cycles to Enhance Accuracy in Multi-Sport Selection Processes
Written by Ben Keller · Jun 23, 2026
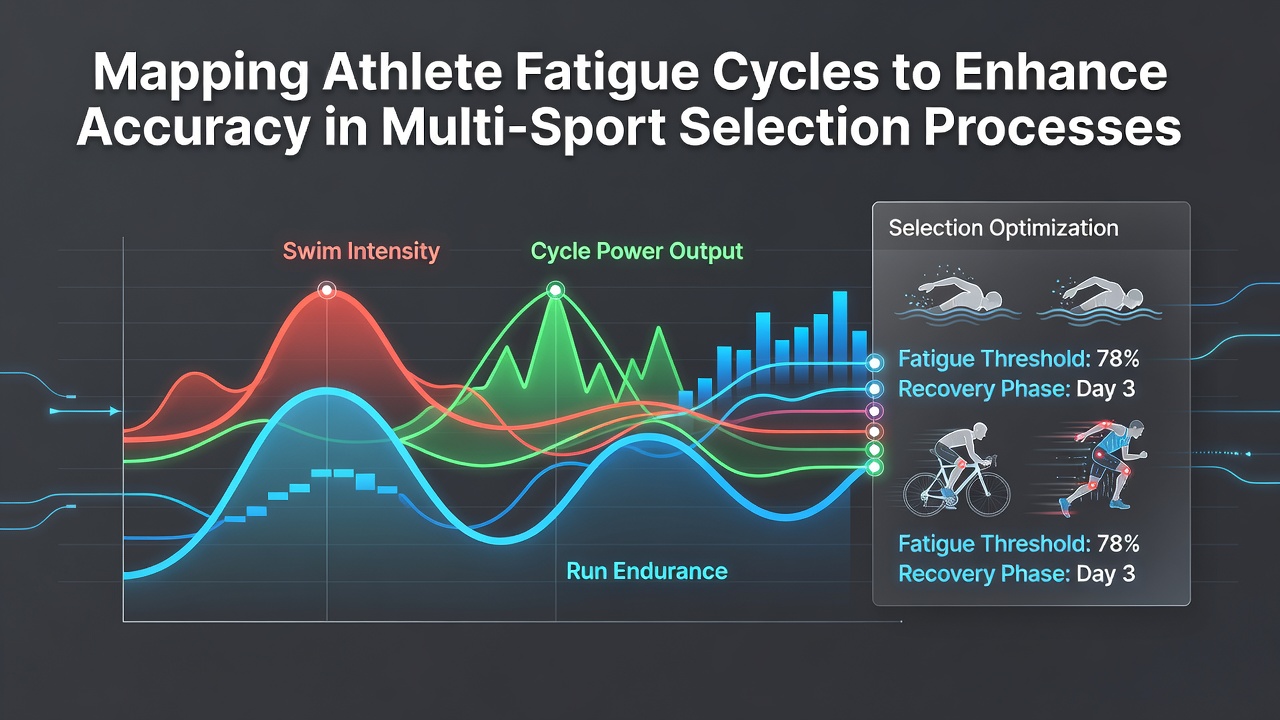
Mapping Athlete Fatigue Cycles to Enhance Accuracy in Multi-Sport Selection Processes
Researchers track athlete fatigue cycles through physiological markers including heart rate variability, blood lactate levels, and sleep patterns, and these data sets help refine selection decisions in events that combine multiple disciplines such as triathlons, modern pentathlon, and combined team competitions. Data from monitoring programs shows that athletes experience distinct recovery windows after high-intensity efforts, and mapping these cycles allows selectors to predict performance reliability across sequential events held within days of each other.
Understanding Fatigue Patterns in Multi-Discipline Athletes
Studies conducted by the Australian Institute of Sport reveal that endurance and power athletes display different recovery timelines after competition, with endurance specialists often requiring 48 to 72 hours for full neuromuscular restoration while power-focused competitors regain baseline strength in 24 to 36 hours. Observers note that combining these timelines creates complex scheduling challenges when athletes must compete in multiple sports or events during a single tournament window, and teams that integrate wearable sensor data into their planning reduce selection errors by aligning athlete availability with event demands.
Monitoring protocols collect continuous metrics from devices placed on the wrist or chest, and algorithms process this information to generate individualized fatigue profiles. Those profiles highlight periods when an athlete's output drops below optimal thresholds, and selection committees use the profiles to decide whether an individual can sustain performance across a full program that includes swimming, cycling, running, and shooting segments on consecutive days.
Data Collection Methods and Analysis Tools
Coaches gather baseline measurements during preparatory phases, then compare them against daily readings taken before and after training blocks, and this comparison produces graphs that illustrate rising and falling fatigue indices over weeks or months. Research from the Norwegian School of Sport Sciences demonstrates that combining subjective wellness questionnaires with objective markers such as creatine kinase levels improves the accuracy of fatigue predictions, particularly when athletes transition between sports that tax different energy systems.
Software platforms integrate GPS tracking, force plate data, and hormonal assays into unified dashboards, and analysts review these dashboards to identify recurring patterns that precede performance declines. Teams that maintain longitudinal records spanning multiple seasons can forecast how an athlete's fatigue response changes with age, training load increases, or travel across time zones, and this forecasting supports more precise roster choices for international multi-sport gatherings.
Application in Selection for Combined Events
Selectors in programs preparing for the 2026 multi-sport calendar examine fatigue maps when finalizing lineups for events scheduled in June 2026, and they prioritize athletes whose recovery curves align with the specific sequence of disciplines required. One documented case involved a national squad that adjusted its roster after reviewing cycle data showed several candidates would still carry residual fatigue from earlier rounds, and the adjusted selection produced higher overall team scores in subsequent competitions.
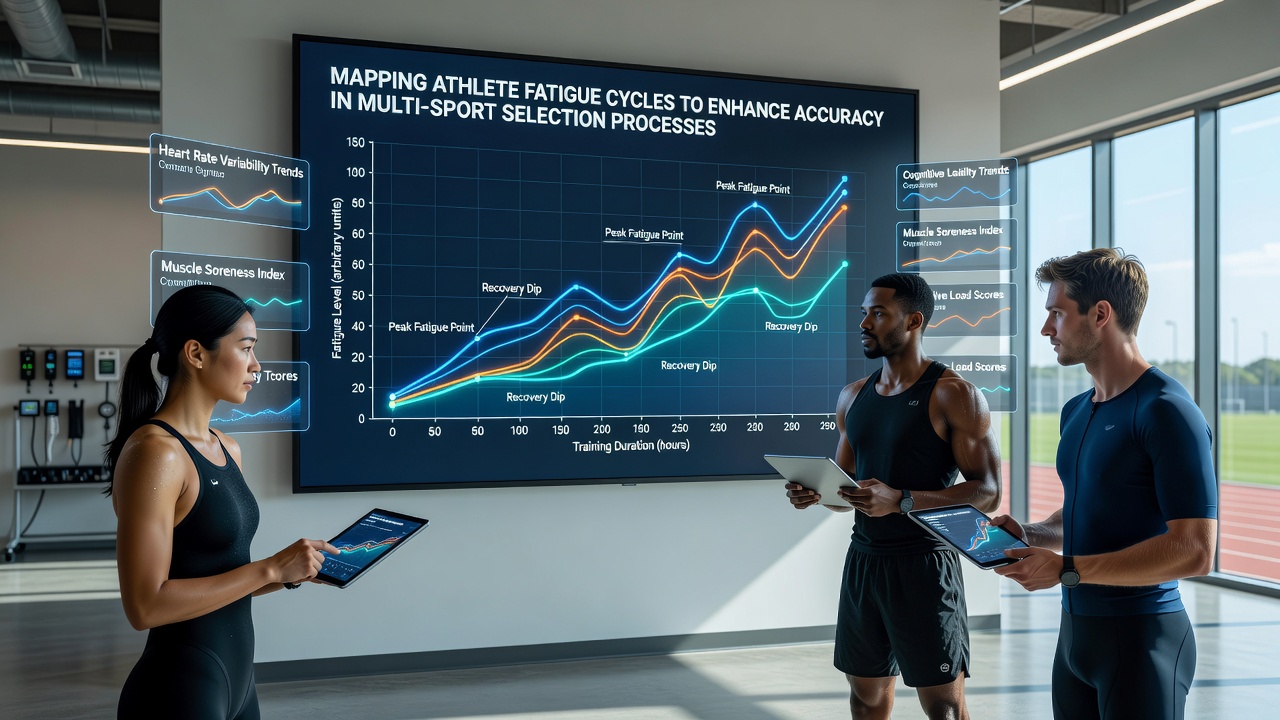
Event organizers provide competition schedules months in advance, allowing support staff to model expected fatigue accumulation based on event spacing and travel requirements, and these models incorporate historical data from similar tournaments to estimate cumulative load. When two events fall within 36 hours of each other, selectors often favor athletes whose profiles indicate faster parasympathetic reactivation, because this marker correlates with quicker return to high-output performance in the second discipline.
Challenges and Refinement of Mapping Techniques
Variability in individual responses remains a persistent factor, since genetic differences, nutrition habits, and psychological stress influence how quickly fatigue dissipates, and analysts must update profiles regularly to maintain relevance. Integration of environmental data such as heat, humidity, and altitude further refines the models, because these conditions alter both the rate of fatigue onset and the duration of recovery needed between events.
Continued collaboration between sports scientists and coaching staffs leads to iterative improvements in mapping accuracy, and updated protocols now include real-time adjustments when unexpected schedule changes occur. Organizations that maintain open data-sharing agreements across national programs accelerate the development of standardized fatigue indices that apply across different multi-sport formats.
Conclusion
Mapping athlete fatigue cycles supplies selection committees with measurable indicators that improve the reliability of choices in multi-sport environments, and the practice continues to evolve through expanded data sources and refined analytical methods. Programs that embed these mapping techniques into routine operations report more consistent outcomes across extended competition calendars, and the approach supports both individual athlete welfare and overall team performance targets.