Integrating Travel Fatigue Indicators from Away Fixtures and Long-Distance Transports into Cross-Discipline Betting Frameworks
Written by Jonas Bennett · Jul 17, 2026
Integrating Travel Fatigue Indicators from Away Fixtures and Long-Distance Transports into Cross-Discipline Betting Frameworks
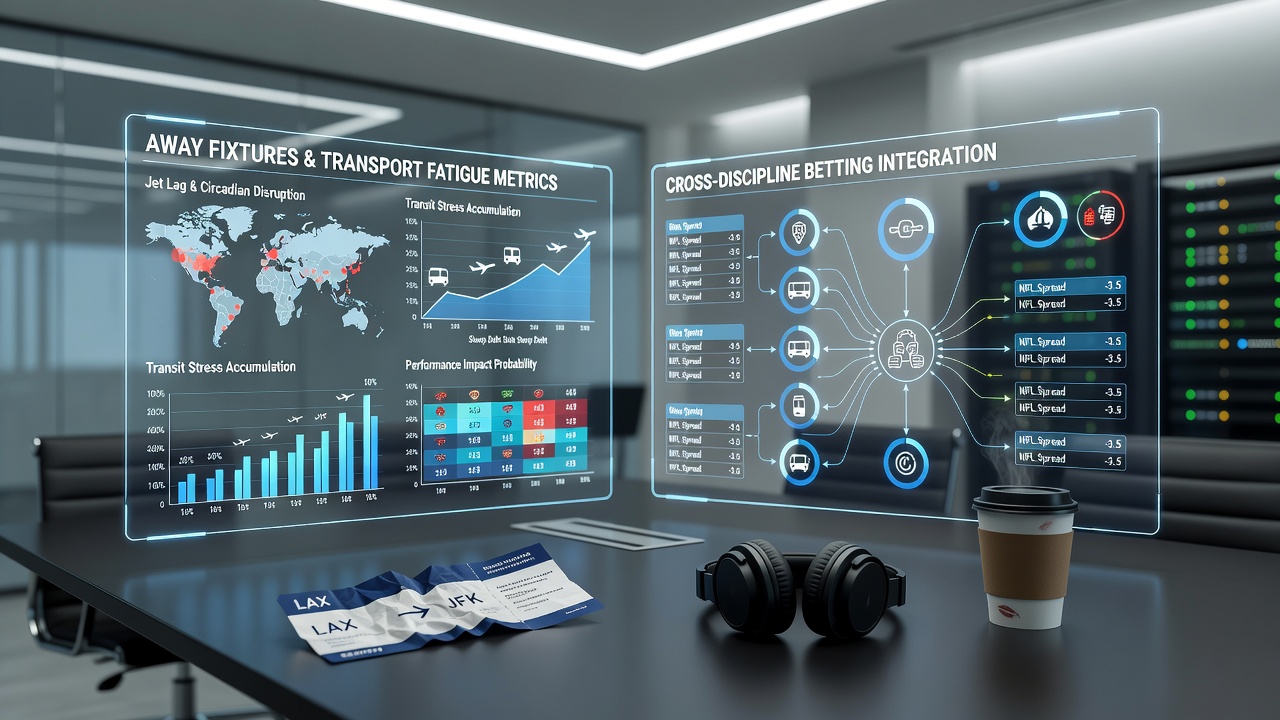
Travel fatigue emerges as a measurable factor when teams or competitors cover significant distances for away fixtures in football or extended hauls to race meetings, and analysts incorporate these indicators into multi-sport prediction models that blend performance data across disciplines. Observers note that recovery periods shorten after overnight flights or long coach transfers, which correlates with reduced sprint outputs and decision-making accuracy in subsequent events according to physiological monitoring programs run by various sports institutes.
Core Indicators of Travel Fatigue Across Sports
Distance traveled, time zone shifts, and sleep disruption form the primary variables that researchers track when building fatigue models for betting applications, while heart rate variability and subjective wellness scores provide supplementary data points collected from wearable devices. Studies conducted by institutions such as the Australian Institute of Sport reveal that athletes crossing multiple time zones experience elevated cortisol levels for up to 72 hours post-arrival, and similar patterns appear in equine athletes after long-distance road or air transport to racetracks. Those who examine fixture schedules find that teams playing consecutive away games separated by more than 500 kilometers show consistent drops in expected goal creation metrics in football, whereas trainers report slower finishing times for horses following journeys exceeding eight hours.
July 2026 schedules already highlight several high-profile interstate and international movements in both codes, including European club sides traveling to pre-season tournaments in Asia and Australian thoroughbred stables shipping runners across the continent for winter carnivals. Data from these movements feeds directly into algorithmic frameworks that adjust probability estimates downward for fatigued participants before odds compilation begins.
Cross-Discipline Modeling Techniques
Analysts merge football match data with racing form through shared fatigue coefficients that scale performance expectations based on transport logs and recovery windows, and machine learning systems now ingest GPS tracking alongside historical results to generate adjusted ratings. One approach applies linear regression to quantify the impact of each additional hour of travel on key performance indicators, then layers those adjustments onto expected goals models and speed ratings simultaneously. Research published in the International Journal of Sports Physiology and Performance demonstrates that such integrated models improve calibration across both team and individual sports when travel variables receive equal weighting to tactical or form-based inputs.
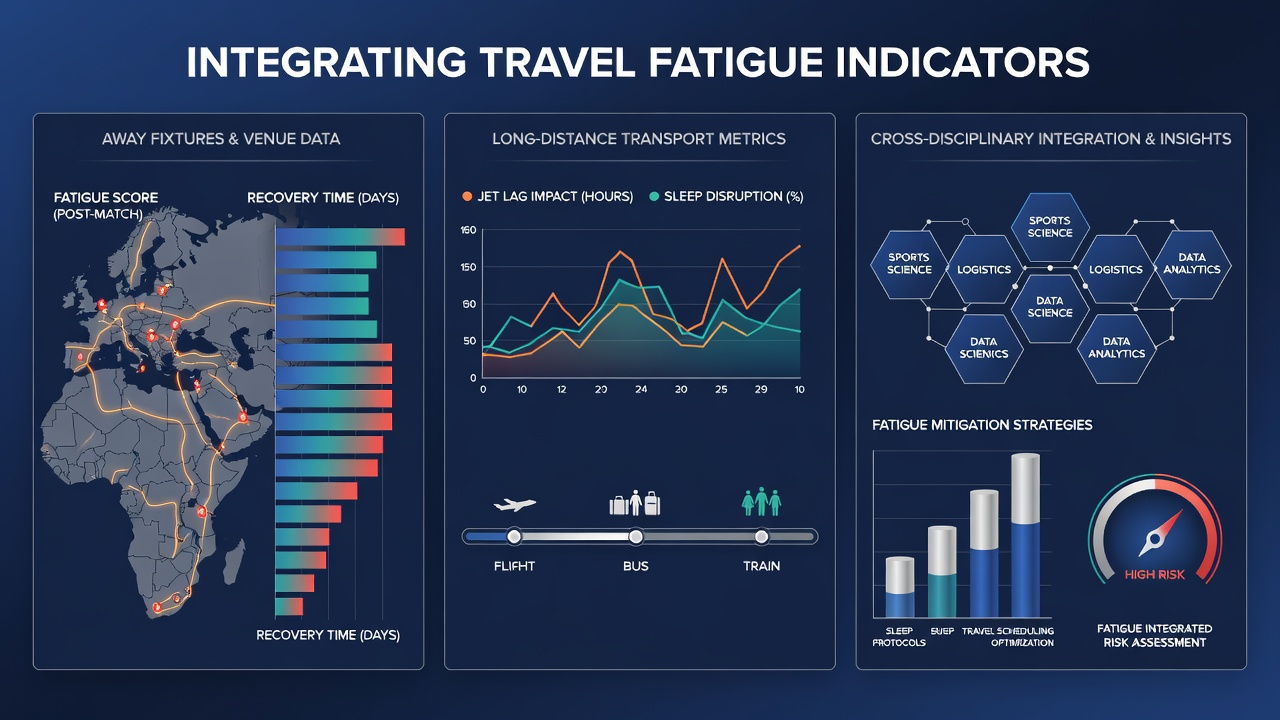
Practitioners build decision trees that flag elevated fatigue risk when a football squad arrives less than 48 hours before kickoff following a transcontinental flight, and they apply parallel thresholds for horses stabled overnight after rail transport exceeding 600 kilometers. These thresholds trigger probability recalibrations that flow through to accumulator constructions spanning multiple sports, allowing consistent risk management across football and racing selections within the same betting framework.
Data Integration and Practical Application
Publicly available transport records combined with fixture calendars supply the raw inputs required for fatigue scoring systems, while proprietary datasets from performance analysis companies add granularity around individual recovery profiles. Canadian researchers at the University of Toronto have documented how multi-sport operators apply fatigue filters to reduce variance in cross-code portfolios, noting measurable improvements in long-term return metrics when away-game travel burdens receive explicit modeling. Those who implement such systems often combine fatigue scores with traditional form variables rather than replacing them, creating hybrid ratings that reflect both historical patterns and current logistical realities.
Real-time updates become feasible when operators integrate live flight and traffic data feeds, enabling last-minute adjustments to model outputs ahead of market movements. This process remains particularly relevant during condensed summer schedules in July 2026, when overlapping international windows increase the frequency of long-haul movements across both football and racing calendars.
Conclusion
Frameworks that systematically embed travel fatigue indicators from away fixtures and extended transports deliver more calibrated outputs when applied consistently across football and racing disciplines. Continued refinement of these models depends on expanding access to standardized recovery and transport datasets, while July 2026 fixtures will provide fresh case material for ongoing validation. Observers expect further adoption as data collection improves and cross-discipline operators seek additional edges derived from logistical variables rather than performance metrics alone.