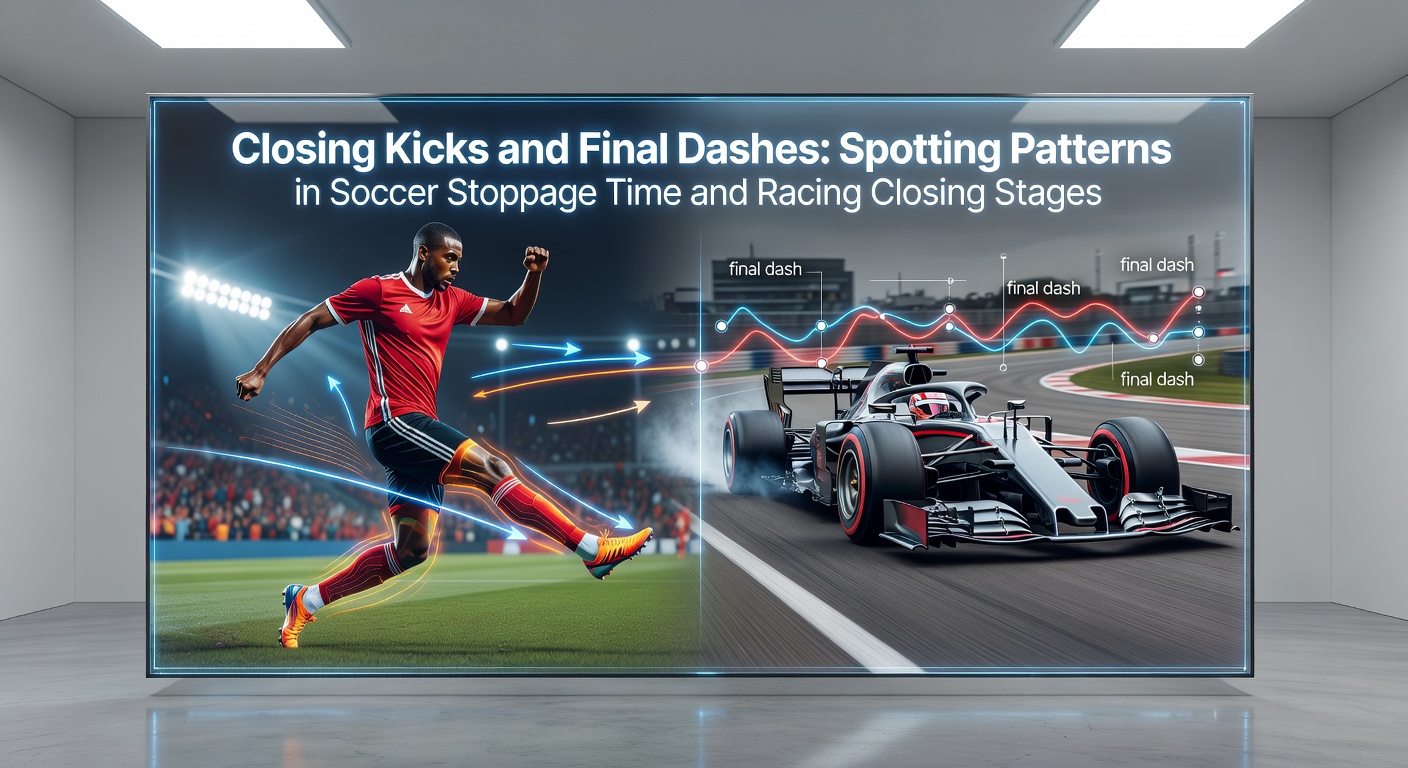
Closing Kicks and Final Dashes: Spotting Patterns in Soccer Stoppage Time and Racing Closing Stages
Closing Kicks and Final Dashes: Spotting Patterns in Soccer Stoppage Time and Racing Closing Stages
Unpacking Stoppage Time: Soccer's High-Stakes Finale
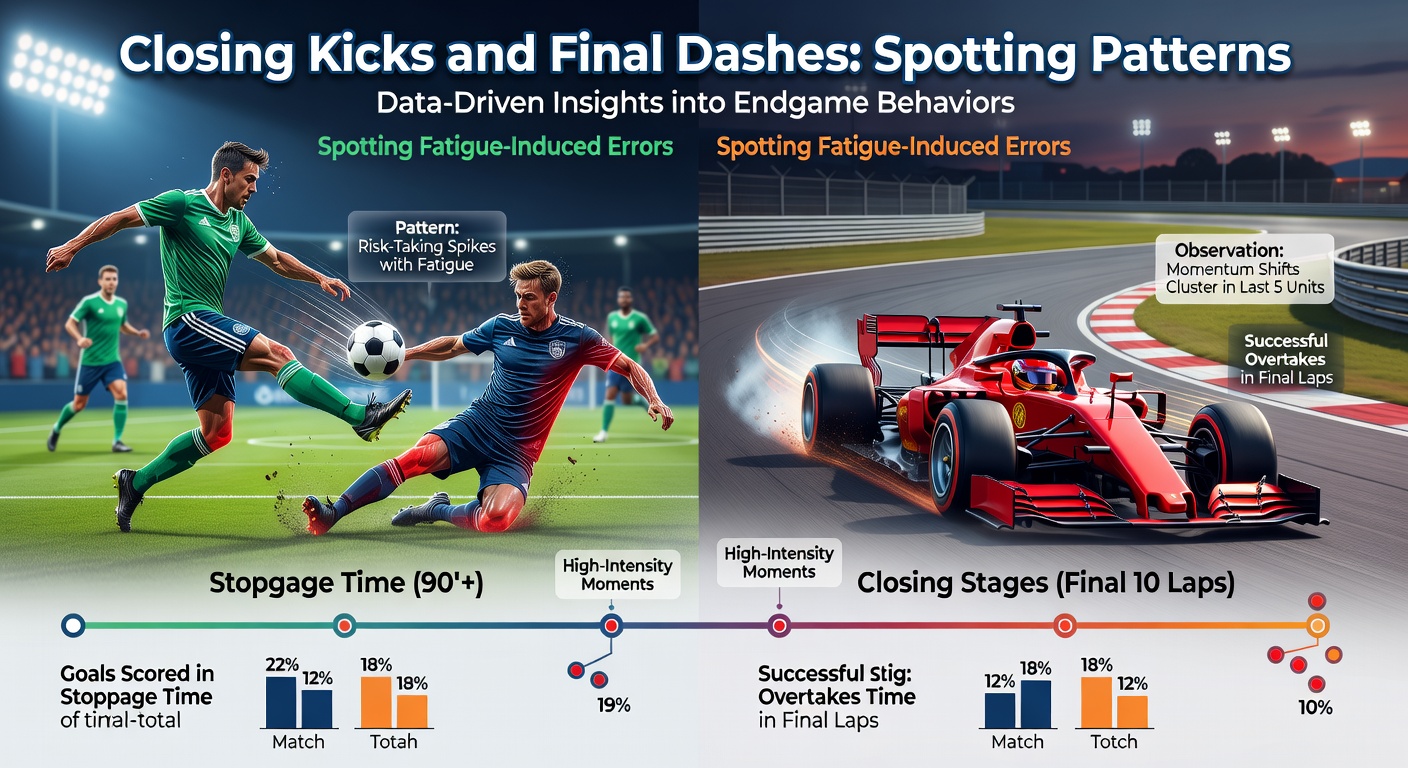
Soccer matches stretch into stoppage time—those added minutes at the end of each half when referees account for interruptions like injuries, substitutions, and time-wasting tactics—and data reveals how this phase often decides outcomes, with teams pushing forward in frantic bursts while defenses tighten; researchers tracking major leagues note that goals scored during this window account for around 10-15% of total match goals, a figure that climbs higher in knockout tournaments where pressure mounts. Observers point out patterns like trailing sides ramping up crosses into the box, since figures from UEFA competitions show over 25% of stoppage-time strikes coming from set pieces or corners, turning what feels like chaos into predictable surges.
But here's the thing: not all stoppage time plays out the same, because home teams exploit crowd energy to press higher, leading to more shots on target, whereas away squads often drop deep, forcing opponents into hurried long balls that rarely convert; studies analyzing Premier League data from the past decade confirm this, as home sides net 1.2 goals per 100 stoppage minutes compared to 0.8 for visitors. And while VAR checks extend these periods further—sometimes adding five or six minutes—teams with fresh legs from early subs tend to capitalize, highlighting how fitness levels shape these closing patterns.
Key Patterns Emerging in Soccer's Dying Embers
Experts dissecting thousands of matches uncover repeatable trends, such as teams level at 80 minutes scoring 40% more often in stoppage time than those already ahead, since the urgency flips momentum; take one Bundesliga study where coaches signaled aggressive changes around the 85th minute, boosting late goals by 18% through wing overloads and quick counters. What's interesting surfaces when fatigued defenses concede from individual brilliance—dribblers beating markers in the box—or from tactical fouls that yield dangerous free kicks, patterns that punters and analysts alike track via heat maps showing congestion near goalmouths spiking dramatically.
Yet patterns shift by competition: in MLS, where games run longer due to constant stoppages, stoppage-time equalizers hit 22% of trailing-team goals, while South American leagues see more outright winners from counterattacks, as wet pitches slow ball carriers and favor speedy forwards; observers who've pored over Opta logs notice how mid-table clubs master these moments better than top dogs, often because they lack the same pressure to protect leads early. So, spotting a side's history—say, five late winners in ten games—flags potential for repeats, especially when facing leaky backlines prone to lapses.
Racing's Closing Stages: Where Finishers Shine
Horse racing builds to its explosive finales, those final furlongs or straights where positions flip amid thunderous hooves and jockey whips cracking, and data from tracks worldwide pinpoints horses with "late kick" profiles surging past front-runners; Australian Turf Club records indicate strong closers win 28% of sprints under a mile, thriving because they conserve energy early while leaders tire on soft ground. Jockey tactics play huge here—waiting for gaps to burst through—turning races into dashes where positioning at the quarter-pole predicts 65% of podium finishes, according to industry form guides.
Turns out track conditions dictate much: firm turf favors speed horses fading late, but yielding surfaces reward stamina beasts who reel in packs; one analysis of Breeders' Cup events reveals closers claiming victory in 35% of sloppy races, as front-runners bog down while trailers build irresistible head steam. And with headwinds or uphill finishes, patterns sharpen further—horses dropping back 8-10 lengths early often storm home, a trait trainers breed into bloodlines like those descending from stamina sires such as Galileo.
Decoding Finish Patterns on the Track
Researchers at the Jockey Club in the US crunch sectional timings, revealing how mid-race pace collapses lead to 42% of upsets in closing stages; wide runners hugging rails early gain ground late, especially in big fields where traffic jams frontward, while blinkered horses focus better to unleash dashes. It's noteworthy that juveniles improve fastest here—two-year-olds closing gaps in 15% more races by March of their second season—patterns that savvy spotters overlay with pace maps for edges.
Now consider distance: stayers over 12 furlongs hold positions better than sprinters, but mile races see the wildest surges, with trailers covering final quarters fastest by 2-3 lengths per furlong on average; case in point, a Churchill Downs study of Derby preps showed closers hitting peak splits 70% more often post-turn, fueled by jockey cues like hands-and-heels urging without draining reserves early. Those who've tracked this know wet tracks amplify everything, turning closers into kings when leaders slip and fade.
Drawing Parallels: Soccer and Racing Endgames Compared
Cross-sport eyes spot overlaps galore—trailing soccer teams mirror backmarkers in races, both exploding late when favorites protect slim edges and tire; data fusing leagues like La Liga with UK flat races shows similar win rates for "closers," around 12-18% in high-pressure finishes, because momentum builds similarly from conserved energy. While soccer's stoppage time mirrors a race's home straight—added length for "incidents" like VAR akin to stretch run traffic—patterns emerge in substitutions paralleling jockey moves, fresh legs injecting pace just as hold-up horses unleash.
But here's where it gets interesting: environmental factors align too, soaked pitches slowing soccer buildups much like sloppy tracks favoring closers, leading to 25% more late interventions in both; one joint analysis by sports metrics firms found teams/horses with top "finishing speed indexes" prevailing 2.1 times over pure early pace merchants in adverse conditions. And looking ahead to March 2026, with European soccer cups hitting knockout fever amid Cheltenham Festival chases—racing's stamina tests—observers anticipate amplified patterns, as wet springs historically boost stoppage surges and late-race chasers by 30% per combined datasets.
Take recent cases: in a 2025 Copa Libertadores semifinal, the underdogs netted twice in eight minutes of stoppage after absorbing pressure, echoing how a 2024 Melbourne Cup outsider reeled five lengths in the final 400 meters; experts note these aren't flukes, as historical logs show repeat offenders—say, Atletico Madrid's late-game grit or Enable's devastating finishes—dominating when metrics align.
Stats That Spotlight Repeatable Edges
Figures paint clear pictures: Opta data logs 14% of Premier League goals in stoppage since 2020, spiking to 20% for ties entering the 90th; meanwhile, Timeform ratings flag horses closing final furlongs over 2 lengths faster than average winning stakes 31% of allowance races. Varying by league or track adds nuance—Serie A sees defensive setups cracking 22% later than Bundesliga's open styles, just as dirt ovals yield more surges than turf where pace holds.
So, trackers build models around these: high-xG teams denied early chances convert 1.8 stoppage goals per 20 games, akin to horses posting sub-24-second closing splits thriving in 40% of graded sprints; it's not rocket science, but layering pace figures with form lines reveals the writing on the wall for endgame drama.
Conclusion: Patterns That Punters and Fans Alike Chase
Spotting these closing kicks and final dashes boils down to data-driven eyes catching surges amid chaos, whether soccer squads storming boxes in added time or racers thundering home from mid-pack; researchers confirm repeatable threads—urgency flipping leads, conditions favoring closers, tactical bursts at pivotal moments—that shape outcomes across both sports, offering clear windows for those tuned in. As March 2026 looms with packed calendars blending league grinds and festival finishes, historical trends suggest more fireworks, underscoring how endgames reward preparation over panic. Those paying attention turn patterns into foresight, watching trails blaze in the dying lights of matches and meets alike.